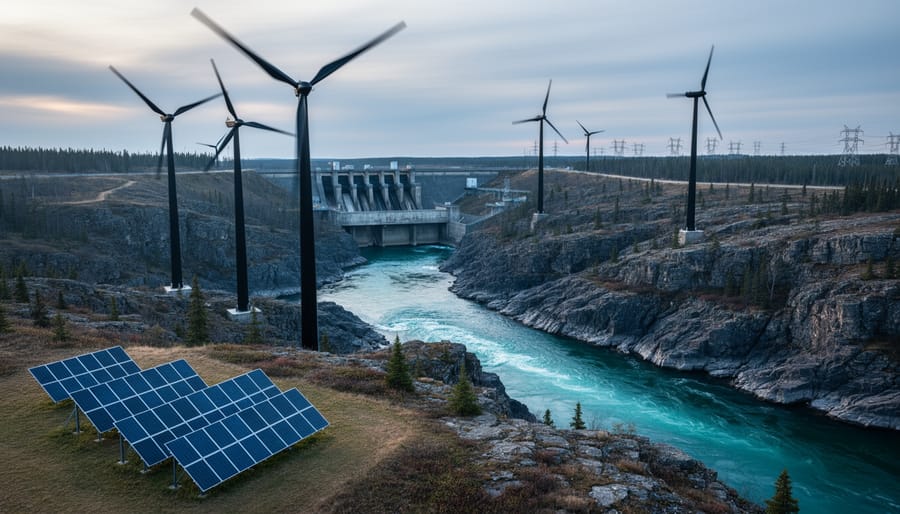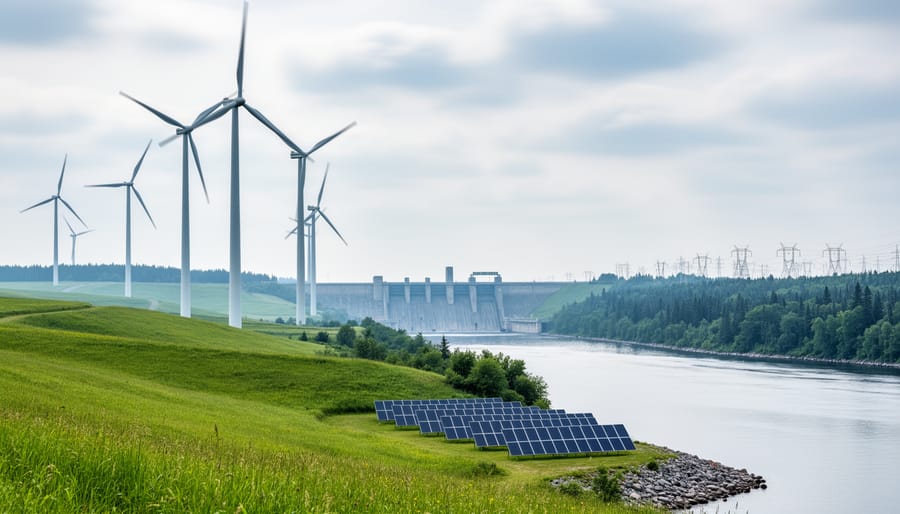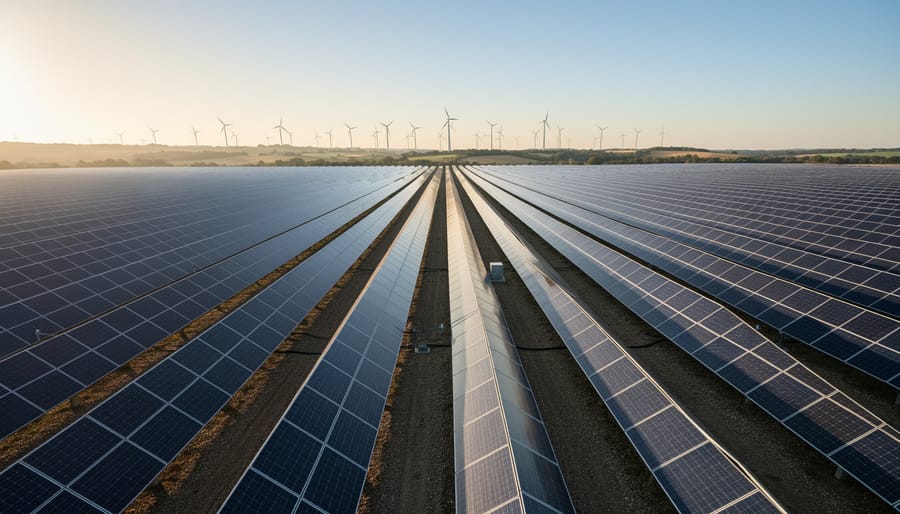
Solar and wind power have crossed a decisive threshold: they’re now the cheapest sources of new electricity generation. In 2024, onshore wind delivered energy at a global weighted average of $0.034 per kilowatt-hour, while solar PV came in at $0.043 per kWh. For context, utility-scale solar projects currently range from $24 to $96 per megawatt-hour, and onshore wind sits between $24 and $75 per megawatt-hour. Compare that to combined-cycle natural gas at $51 to $129 per MWh, and the financial case becomes clear.
This shift represents more than incremental improvement. Lazard’s 2026 analysis confirms that renewables remain the most cost-competitive option for new power generation on an unsubsidized basis, a statement that would have seemed optimistic just a decade ago. For business owners evaluating energy investments, the question has evolved from “Can we afford renewables?” to “Can we afford not to adopt them?”
The answer depends on several critical factors: your energy consumption patterns, available space for installations, local solar and wind resources, and whether grid connection or battery storage makes sense for your operation. Onshore wind costs dropped 3% year-over-year, signaling that the downward price trajectory continues. What looked like a future trend is now present reality, transforming renewable energy from an aspirational choice into a financially sound business decision backed by competitive market economics.
Current Energy Generation Costs: Wind vs. Solar in 2026
Understanding what renewable energy actually costs per unit of electricity generated gives you a clear baseline for business planning. The levelized cost of electricity (LCOE) measures the average total cost to build and operate a power-generating asset over its lifetime, divided by the total electricity it produces. Think of it as the price per kilowatt-hour you’d need to charge to break even on the investment.
The numbers for 2026 show both technologies delivering competitive energy costs. Solar PV achieved a global weighted average LCOE of USD 0.043/kWh in recent measurements, while onshore wind came in at USD 0.034/kWh. At utility scale, the Lazard LCOE ranges place solar between $40 and $98 per megawatt-hour, with onshore wind spanning $24 to $75 per megawatt-hour.
| Technology | LCOE ($/kWh) | Utility-Scale Range ($/MWh) | Comparison Baseline |
|---|---|---|---|
| Onshore Wind | 0.034 | 24-75 | Combined cycle gas: $51, $129/MWh |
| Solar PV | 0.043 | 40-98 |
These figures confirm that renewables remain the most cost-competitive form of new-build generation on an unsubsidized basis. Onshore wind’s 3% year-on-year LCOE reduction demonstrates continued cost improvements, while solar maintains strong competitiveness despite broader market pressures.
For business decision-makers, this data reveals a crucial insight: both technologies now generate electricity at rates below or comparable to combined cycle gas turbines, which range from $51 to $129 per megawatt-hour. Your energy costs won’t just support sustainability goals; they can actively strengthen your bottom line. The specific economics for your facility depend on site conditions, project scale, and local grid dynamics, but the foundation is clear: renewable energy has crossed the threshold from environmental choice to economic advantage.

Breaking Down Wind and Solar System Costs
Wind Power System Components and Investment
Wind power infrastructure represents a layered investment where each component serves a critical structural and operational function. Understanding these elements helps businesses evaluate whether the economics align with their energy strategy.
The Turbine Assembly
The turbine itself, blades, nacelle housing the generator, and control systems, typically accounts for the largest share of upfront capital. Modern commercial-grade turbines range from 2 to 5 megawatts for distributed generation projects, with larger utility-scale units reaching 8 MW or more. Blade length directly impacts energy capture: longer blades sweep more area and generate more electricity, but require stronger materials and more robust engineering. The nacelle contains the gearbox, generator, and electronics that convert rotational energy into grid-compatible electricity.
Structural and Site Infrastructure
Tower height determines how effectively you access stronger, steadier winds at altitude. Commercial installations typically use towers between 80 and 120 meters tall, constructed from tubular steel sections. Foundations must anchor these structures against extreme wind loads and vibration, often requiring extensive concrete work and soil engineering, particularly challenging in areas with unstable ground conditions. Grid connection infrastructure includes transformers, substations, and transmission lines to deliver power from the turbine location to your facility or the utility grid.
Land Use and Access
Wind projects need physical space not just for turbines but for access roads, laydown areas during construction, and maintenance clearances. Unlike solar arrays, turbines occupy relatively small footprints but require setback distances from property lines and buildings, affecting how many units you can deploy on a given site.
Solar Power System Components and Investment
Solar power installations divide investment across several interconnected components, each contributing to the system’s overall efficiency and longevity. Understanding these elements helps businesses evaluate where capital goes and why different projects carry different price tags.
Solar panels themselves represent 20-40% of total system costs. Modern photovoltaic modules come in monocrystalline, polycrystalline, and thin-film varieties, with efficiency ratings and warranty terms that directly impact long-term value. Higher-efficiency panels cost more upfront but generate more electricity per square foot, crucial for businesses with limited roof or land space.
Inverters convert the DC electricity panels produce into AC power your facility can use, typically accounting for 10-15% of system costs. String inverters serve multiple panels, while microinverters work panel-by-panel, offering different trade-offs between cost, performance monitoring, and shade tolerance.
Mounting and racking systems secure panels to roofs or ground structures, requiring engineering that accounts for wind loads, snow accumulation, and roof integrity. Ground-mount systems offer easier maintenance access but consume land; rooftop installations maximize existing space but may require structural reinforcement.
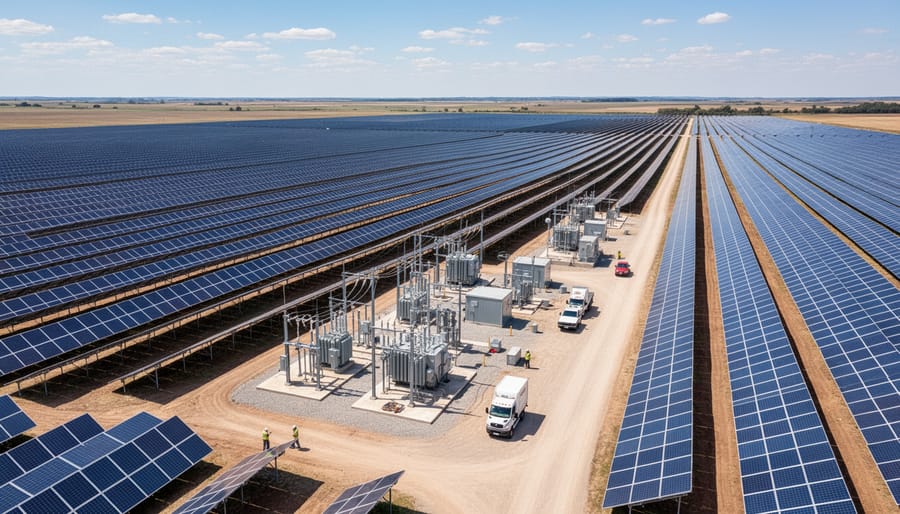
Electrical infrastructurewiring, conduit, disconnect switches, monitoring equipment, and grid interconnection hardware, forms the circulatory system that moves power safely through your facility. This “balance of system” category often surprises businesses with its contribution to total project economics, particularly when existing electrical panels need upgrades to handle bidirectional power flow.
Space requirements vary dramatically based on system size and panel efficiency, with commercial installations typically needing 5-10 square feet per kilowatt of capacity.
What Drives Renewable Energy Pricing in 2026
Renewable energy pricing doesn’t exist in a vacuum. Multiple forces push costs up or down, and they affect wind and solar in different ways. Understanding these drivers helps you predict project economics and identify where each technology gains or loses ground.
Policy and Regulatory Shifts
Federal tax credits and state incentives directly shape project viability. When the Investment Tax Credit (ITC) for solar changes percentages or the Production Tax Credit (PTC) for wind adjusts payment terms, your bottom line moves immediately. Beyond direct subsidies, renewable portfolio standards and carbon pricing mechanisms create market demand that either accelerates deployment (lowering costs through scale) or creates bottlenecks (raising prices through competition).
The Cost Driver Landscape
Several interconnected factors determine what you’ll actually pay:
- Policy and regulatory environment: Tax credits, renewable mandates, and carbon pricing shift competitive dynamics
- Supply chain and material costs: Steel, copper, silicon, and rare earth availability directly impact equipment pricing
- Permitting timelines: Lengthy approval processes add carrying costs and delay revenue generation
- Energy storage integration: Battery requirements for firming renewable output add significant capital expense
- Grid connection requirements: Transformer upgrades and transmission capacity influence total project cost
- Capacity utilization: How often your system generates at full potential affects per-kilowatt-hour economics
Supply Chain Realities
Material costs hit wind and solar differently. Solar depends heavily on polysilicon and silver, making it vulnerable to semiconductor market dynamics. Wind requires massive quantities of steel, fiberglass, and rare earth magnets for generators. Recent inflationary pressures raised equipment costs across both technologies, though solar manufacturing scale has absorbed some impact better than wind’s more limited production volumes.
The Interconnection Challenge
Getting connected to the grid has become a major cost variable. Electric interconnection queues now stretch years in many regions, creating uncertainty and adding financing costs. Wind projects typically require more transmission infrastructure due to their remote locations, while distributed solar can sometimes leverage existing service connections. Current interconnection trends show utilities struggling with rapid queue growth, making early application and strategic site selection increasingly important.
Storage integration affects the technologies asymmetrically. Solar’s predictable daily production curve often pairs naturally with battery systems, creating additional cost but also revenue opportunities through time-shifting. Wind’s variable but less predictable output makes storage pairing more complex and potentially less economical depending on local wind patterns and grid needs.
Self-Installation vs. Professional Development: What Businesses Need to Know

The decision between self-managed installation and professional development fundamentally depends on project scale and technical complexity. Small-scale solar arrays under 10 kW may suit businesses with in-house electrical expertise and straightforward roof access, while wind installations almost universally require professional engineering due to structural loads, tower erection safety, and grid interconnection protocols. Business renewable solutions typically justify professional oversight once capacity exceeds what a maintenance team can safely commission and maintain.
Grid-tied systems introduce regulatory and technical barriers that self-installation rarely overcomes cost-effectively. Utility interconnection agreements demand certified electrical work, anti-islanding protection, and code compliance documentation that most businesses lack the licensing to provide. Off-grid configurations offer more flexibility for self-managed projects, particularly for remote facilities experimenting with portable wind turbines or supplemental solar charging stations, but these applications rarely deliver the capacity that justifies renewable energy economics at business scale.
Pros
- Self-managed solar projects under 5 kW can reduce labor costs by 30-40% for businesses with qualified electricians.
- Hands-on installation builds internal maintenance competency for routine component replacement.
- Small off-grid systems allow controlled experimentation without utility involvement or permitting delays.
- Direct procurement control eliminates contractor markup on equipment purchases.
Cons
- Safety risks from high-voltage DC systems and fall hazards during roof mounting require specialized training.
- Warranty claims often fail when manufacturers discover non-certified installation work.
- Grid interconnection applications get rejected without licensed contractor signatures and inspection records.
- Hidden costs emerge from incorrect system sizing, improper grounding, and failed inspections requiring rework.
- Wind turbine foundation engineering and tower assembly exceed the capabilities of general construction teams.
Professional development makes business sense when project capacity exceeds 25 kW, when grid connection is required for net metering benefits, or when structural modifications involve engineered mounting systems. Developers handle permitting, interconnection negotiations, and performance guarantees that protect your investment. The installed cost premium of 15-25% typically pays for itself through optimized system design, avoided rework, and faster commissioning timelines that put generation online sooner.
5 Steps to Evaluate Cost-Effectiveness for Your Business
Deciding between wind, solar, or a combined approach requires methodical analysis tailored to your business’s unique circumstances. Rather than chasing the lowest upfront number, effective evaluation balances multiple factors that determine long-term value. Here’s a structured framework to guide your decision.
- Analyze Your Energy Consumption PatternsStart by examining your actual electricity usage across different times of day, seasons, and operational cycles. Pull 12 months of utility bills to identify peak demand periods and baseline loads. Manufacturing facilities with 24-hour operations have different needs than retail operations with daytime-heavy consumption. Understanding when you use energy most heavily determines whether solar’s daytime generation or wind’s more variable but potentially nighttime production better matches your profile. Track not just total kilowatt-hours but demand charges and time-of-use rate structures that affect your costs.
- Assess Site-Specific ResourcesYour location dictates which technology makes practical sense. For wind, you need sustained average speeds above 6 meters per second at hub height, which requires professional wind resource assessment over at least several months. Solar depends on annual irradiance levels and available unshaded roof or ground space with appropriate orientation. Saskatchewan businesses often have strong wind resources but must also evaluate solar potential given today’s improved panel efficiency. Consider physical constraints: do you have three acres for a small wind turbine installation or adequate roof capacity for a solar array? Site assessment reveals whether one technology clearly outperforms or if hybrid deployment maximizes your resources.
- Model Financial Scenarios with Current DataBuild realistic projections using verified 2026 figures. With utility-scale solar ranging from $24 to $96 per megawatt-hour and onshore wind between $24 and $75 per megawatt-hour, smaller commercial installations typically see higher per-unit costs but still benefit from competitive pricing. Calculate payback periods under different scenarios: conservative, moderate, and optimistic energy price inflation. Factor in your current electricity rate, projected rate increases, and how much of your consumption the system would offset. Compare renewable sources against your baseline cost and model sensitivity to key variables like production variability and maintenance expenses.
- Evaluate Available Incentives and FinancingResearch federal and provincial programs that reduce effective project costs. Accelerated capital cost allowances, production-based incentives, and renewable energy credits can significantly improve returns. Investigate financing structures beyond conventional loans: power purchase agreements, lease arrangements, and green bonds offer paths to renewable adoption with different cash flow implications. Some incentives favor specific technologies or scales, which may tip the balance toward wind or solar for your particular project size and business structure.
- Plan for Storage and Grid Integration NeedsDetermine whether you’re pursuing grid-tied generation with net metering, off-grid independence, or a hybrid approach with battery storage. Grid connection costs and utility interconnection requirements vary by jurisdiction and system size. Battery storage adds upfront expense but enables energy arbitrage and backup capability during outages. Assess whether your operations require uninterrupted power that justifies storage investment or if grid-tied generation with standard utility backup serves your needs. Consider future expansion plans and whether your initial installation allows modular scaling as your business grows.
This evaluation framework moves you past surface-level cost comparisons toward a defensible business case. The technology delivering the best return depends entirely on your consumption profile, site characteristics, financial situation, and operational requirements. Most businesses benefit from professional energy audits and feasibility studies before committing capital, as these upfront investments prevent costly mismatches between system design and actual needs.
Comparing Total Project Economics: Beyond Initial Price

Looking at renewable energy purely through an upfront price lens misses half the story. The cheapest installation today won’t necessarily deliver the strongest returns over two decades of operation. To evaluate true cost-effectiveness, you need to examine how these systems perform across their entire lifespan.
Capacity Factor: How Often Your System Actually Produces
Wind and solar generate electricity differently throughout the day and year. Onshore wind typically achieves capacity factors of 35-45%, meaning turbines produce at that percentage of their maximum potential over time. Solar installations generally hit 20-30% capacity factors due to nighttime downtime and seasonal variation. A wind system with higher upfront costs but a 40% capacity factor can generate more revenue than cheaper solar panels running at 25% capacity, even if the solar installation cost less per kilowatt installed.
Maintenance and Operational Reality
Solar systems require minimal intervention, occasional panel cleaning, inverter replacement every 10-15 years, and basic electrical checks. Annual maintenance typically runs well under 1% of system value. Wind turbines demand more intensive upkeep: gearbox servicing, blade inspections, tower maintenance, and mechanical component replacement. These operational expenses run higher as a percentage of initial investment, though modern turbines have significantly reduced maintenance requirements compared to earlier generations.
Performance Over Time
Solar panels degrade at roughly 0.5% annually, maintaining 85-90% of original output after 25 years. Wind turbines experience more variable performance curves depending on component wear and environmental conditions. Understanding when solar power farms fail or underperform helps businesses plan realistic production forecasts and budget for eventual replacements.
Return on Investment Timelines
With current pricing, solar installations often achieve payback in 6-10 years for commercial applications, while wind projects may take 8-12 years depending on wind resources and system scale. However, wind’s higher capacity factor can deliver stronger cash flows in years 10-20, potentially offsetting the longer initial payback period. Your specific energy costs, available incentives, and site conditions determine which technology reaches profitability faster for your operation.
Where the Money Goes
Understanding where your renewable energy investment actually goes helps you evaluate proposals and identify potential cost savings. Both wind and solar projects share common expense categories, though the proportions differ significantly between technologies.
Equipment accounts for the largest share in both systems. For solar installations, panels and inverters typically represent 40-50% of total project costs. Wind projects see turbines consuming 60-70% of the budget, reflecting their mechanical complexity and engineering requirements. This equipment-heavy split means technological advances directly impact overall project economics.
Labor and installation services vary by scale and complexity. Solar installations generally require 15-25% of budget for labor, with ground-mounted commercial arrays demanding more site preparation than rooftop systems. Wind projects allocate 10-20% to installation labor, but specialized crane work and tower assembly drive higher hourly rates than solar mounting.
Infrastructure and connection costs create the hidden expense layer. Electrical infrastructure, transformers, grid interconnection studies, and transmission upgrades consume 15-25% across both technologies. Remote sites face steeper infrastructure investments, particularly for wind farms requiring dedicated transmission lines.
Permitting, engineering studies, and project development fees add another 8-15% to total costs. Environmental assessments, structural engineering, utility agreements, and legal reviews apply to both technologies, though wind projects often face more extensive regulatory review processes. Larger projects spread these fixed costs across more capacity, improving per-watt economics.
Frequently Asked Questions About Wind and Solar Costs
Business owners evaluating renewable energy often have similar questions about costs, performance, and decision factors. The answers depend on your specific situation, but understanding these fundamentals helps frame your investment analysis.
Which renewable technology is cheaper to operate long-term?
Onshore wind typically edges out solar PV slightly, with a 2024 global weighted average LCOE of $0.034/kWh compared to solar’s $0.043/kWh, though both have seen dramatic cost reductions. Your site conditions and energy consumption patterns often matter more than these general averages for determining actual operating economics.
How do wind and solar costs compare to natural gas generation?
Renewables now undercut fossil fuels on an unsubsidized basis, with onshore wind and utility-scale solar ranging from $24 to $96 per megawatt hour compared to combined cycle gas at $51 to $129/MWh. This cost advantage has made renewables the most competitive form of new-build generation.
Can you combine wind and solar in a hybrid system?
Hybrid systems capture complementary generation patterns since wind often produces more at night and during winter while solar peaks during summer days. This combination smooths energy delivery and can reduce storage requirements, though it requires careful system design and potentially higher upfront coordination costs.
What makes wind or solar more cost-effective for a specific location?
Wind needs consistent speeds above 12-15 mph and clearance from obstructions, making it ideal for open, elevated, or coastal sites. Solar requires unshaded roof or ground space with good sun exposure and works well in areas with high daytime energy demand that aligns with generation hours.
These cost dynamics continue evolving. Onshore wind saw LCOE drop 3% year-on-year in recent measurements, while solar manufacturing improvements keep driving panel prices down. Neither technology has hit its floor yet, meaning businesses that wait for “perfect” pricing may miss years of generation savings.
The financial planning question that matters most is whether the technology fits your energy profile and site characteristics. A solar array that produces peak power when your facility runs air conditioning delivers different value than the same system serving overnight operations. Wind generates around the clock but varies with weather patterns.
For businesses with variable demand or limited ideal conditions for a single technology, the hybrid approach deserves serious consideration despite higher planning complexity. The complementary generation patterns often justify the coordination effort, especially when you factor in resilience benefits and reduced grid dependence.
The evidence is clear: both wind and solar power have evolved into genuinely cost-competitive energy solutions for businesses in 2026. With onshore wind averaging $0.034 per kilowatt-hour and solar PV at $0.043 per kilowatt-hour on a global weighted average basis, renewables consistently outperform traditional generation on unsubsidized economics. The question is no longer whether these technologies make financial sense, but rather which configuration best serves your specific operational context.
Your site characteristics, energy consumption patterns, available space, and long-term business objectives all influence whether wind, solar, or a hybrid system delivers optimal value. A windy prairie location with ample land presents different opportunities than an urban facility with limited ground space but extensive roof area. The technology that works brilliantly for one business may prove impractical for another, even within the same industry.
This complexity is precisely why professional evaluation matters. Generic cost comparisons provide helpful context, but they cannot replace site-specific analysis that accounts for your local wind resources, solar irradiance, utility rate structure, and available incentives. The difference between a mediocre renewable energy investment and an exceptional one often comes down to proper system sizing, optimal equipment selection, and strategic integration with your existing infrastructure.
Saskatoon Wind & Solar Solutions specializes in helping businesses navigate this transition with confidence, turning comparative data into actionable implementation plans tailored to your operational reality and financial goals.